This report presents a framework to detect and rank potential insider trading activities on Polymarket, using only public onchain data. The analysis covers trades between November 1, 2025, and April 28, 2026.
The framework is to be used as a means of filtering for priority trades that potentially require investigation. The framework is used to rank trades and traders based on the concentration of specific signals, which are indicative of insider trading.
1. Problem
Insider trading is defined as trading by individuals who have non-public information about an event that can be used to gain an unfair edge over other traders. The Commodity Futures Trading Commission (CFTC) regulates the trading of commodity futures, options, and swaps and cites the Commodity Exchange Act as the legal framework for addressing insider trading in Equity Markets. As of now, there is no formal legal framework for insider trading with respect to Prediction markets, except for a few exceptions. Patterns and Outliers can be utilized to detect naive insider trading behaviour such as: large position sizing relative to the market, contrarian bet entries at low prices that pay out, fresh wallets, sweeping existing liquidity, and moving mid-price in the orderbook.
2. Goal
Using the framework, we aim to:
- Estimate the likelihood that a given trade is an insider trade or that a trader is potentially trading based on privileged information.
- Use only onchain data as the source of truth, since API data could be altered in the future.
- Produce a ranking by building a composite score from multiple signals.
3. Scope
3.1. Timeframe
Only trades that fall between November 1, 2025, and April 28, 2026, are analyzed. April 28, 2026 isn’t arbitrary; it’s the end of v1 deployment of the Polymarket smart contracts. Thus, all trades analyzed will be those of v1 only.
A buffer is applied when calculating a wallet’s first trade: wallets with their first trade before November 20, 2025 are not flagged as “fresh wallet” to avoid false positives from the dataset starting cutoff.
3.2. Markets
We only focus on markets that were created after November 1, 2025, and resolved before April 28, 2026. Thus, it follows that all trades analyzed fall within this timeframe, and for any market in this chosen timeframe, all trades are analyzed or no trades are analyzed.
Not all markets are analyzed. Markets with high structural noise and recurring patterns, those where automation and systematic trading dominate, are excluded from the analysis. Markets with the following tags are excluded:
| Tag Excluded | Reason for Exclusion |
|---|---|
| Prices Up or Down | Price Oracle-driven markets, dominated by arbitrage bots hedging against external venues |
| Sports / Esports | Require live event data that’s unavailable in onchain sources, along with high volatility to events |
| Recurring Markets | Repetitive markets like weather and Spotify top songs, with strong automation incentives |
| Tweet Markets | Resolution relies on external event counts, with questions settling days before the market is resolved |
These exclusions do not indicate that insider trading is absent. It’s a decision to limit the scope due to constraints of the dataset.
3.3. Volume
Markets with volume less than 100,000 USD are excluded, so that the focus is on the liquid markets, in order to prevent liquidity issues from polluting the signals. Low liquidity reduces large market orders, while also increasing the number of trades, pushing the mid-price in the order book.
Applying these exclusions, the dataset is reduced to 2% of the original size.
| label | trades |
|---|---|
| all trades | 1.03b |
| shortlisted markets | 25.09m |
| shortlisted markets (volume > $100k) | 18.30m |
4. Dataset
4.1. Data Source
The primary data sources are two Dune Analytics Curated Tables:
| Table | Contents |
|---|---|
polymarket.market_trades | All OrderFilled events emitted by Polymarket CTF and Neg Risk contracts, that include trade details such as token, price, market details |
polymarket.market_details | Metadata for Polymarket prediction markets, including event/market names, questions, outcome tokens, resolution status, and oracle details |
4.2. Full-Order vs Fill-Order
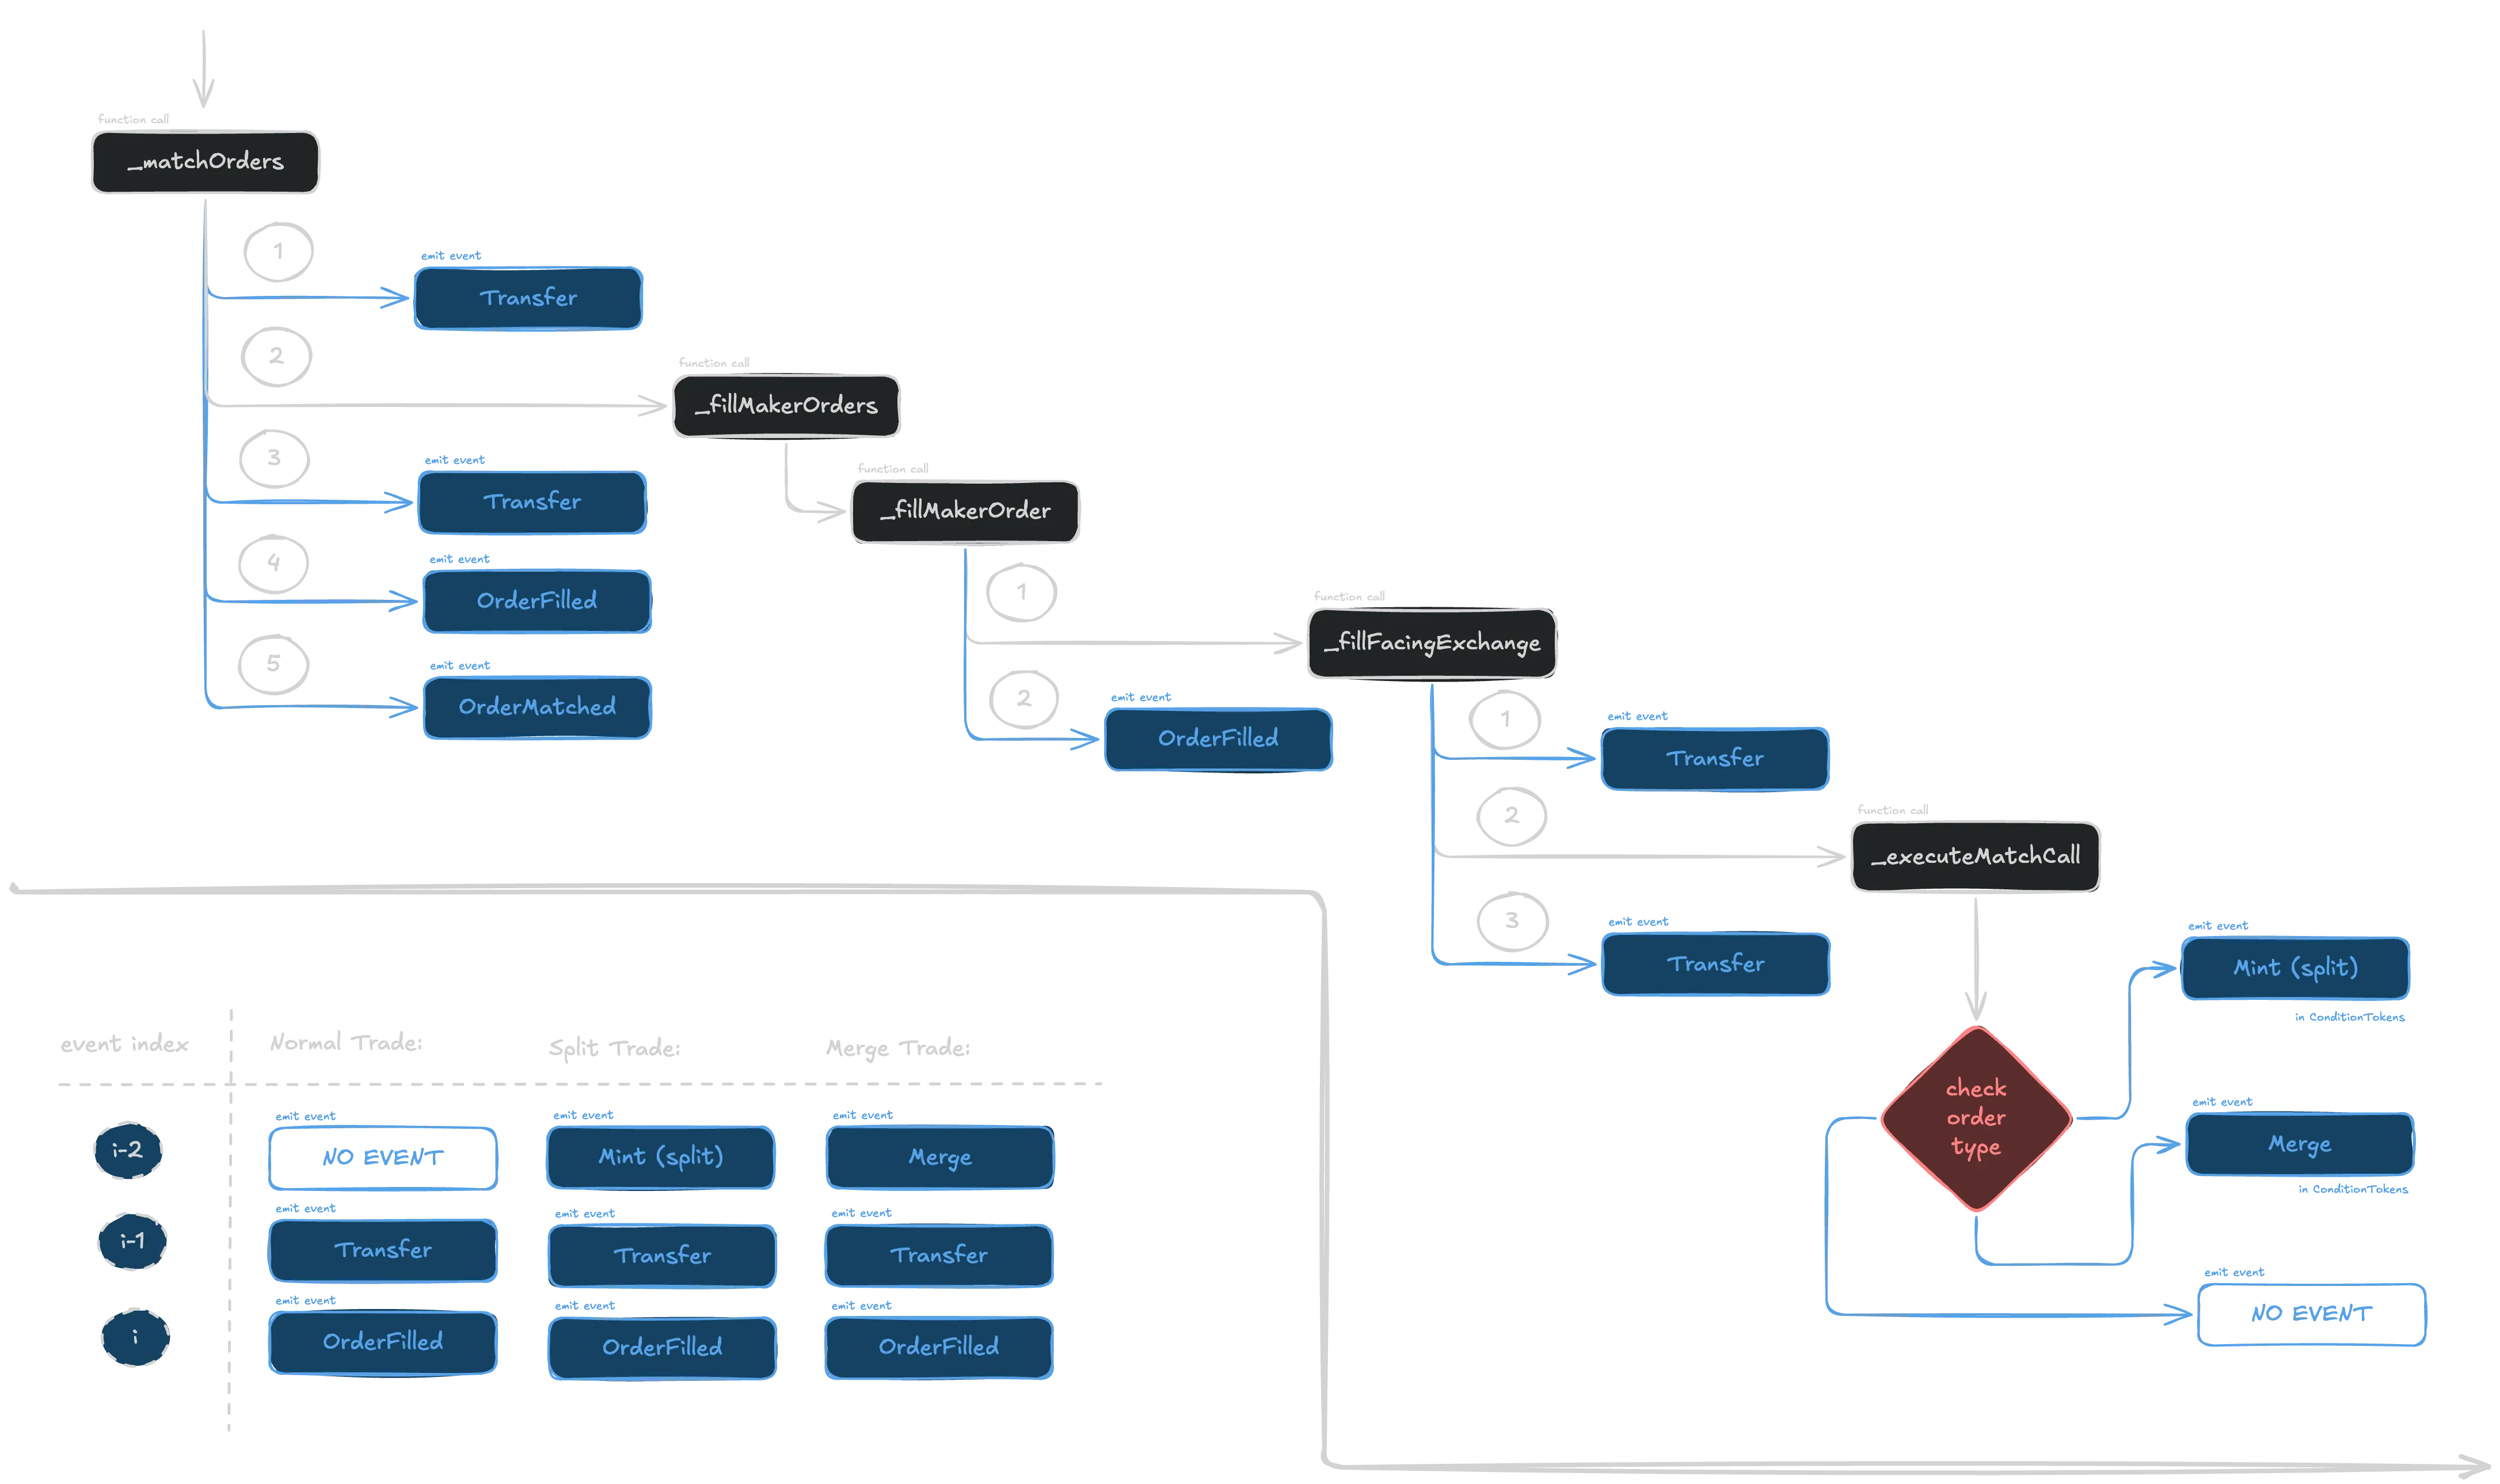
Polymarket emits two distinct OrderFilled events per trade indexed onchain.
Event schema:
OrderFilled (
  index_topic_1 bytes32 orderHash,
  index_topic_2 address maker,
  index_topic_3 address taker,
  uint256 makerAssetId,
  uint256 takerAssetId,
  uint256 makerAmountFilled,
  uint256 takerAmountFilled,
  uint256 fee
)- Fill Order: One event for each individual taker-maker pair that fills a part of the order. The maker is the owner of the order in the orderbook, and the taker is the counterparty filling the order in the orderbook.
- Full Order: One event aggregating the the complete order of a taker. However, a key distinction is that the taker field contains the CTF or Neg Risk contract, and the maker is the actual taker wallet.
A common pre-processing step in existing works is to remove fill-level events and only retain full-order events. This was discovered by Paradigm Data Partner Slivkoff and is used to avoid double-counting when calculating metrics like volume.
In our analysis, we retain the fill orders, as they are used to compute realized spread, the price difference between the fills in a single taker order, which can be used as a signal to detect liquidity sweeps.
4.3 Split and Merge trades
Also pointed out by Paradigm Data Partner Slivkoff, fill-order events can represent 3 types of trade:
- Swap: A standard exchange of YES/NO tokens between the maker and taker, in exchange for USD.
- Split: A taker and maker jointly deposit USD, and receive same amount of YES/NO tokens respectively.
- Merge: A taker and maker jointly deposit same amount of YES/NO tokens, and receive USD.
In our EDA, we found that split and merge trades’ OrderFilled events emit info from the maker’s perspective, i.e only the maker’s token ID and the maker’s price are indexed. The taker’s token ID is constructed from the full order OrderFilled event associated with the transaction, and the taker’s price is computed as (since YES and NO are complementary tokens, the sum is 1 USD).
Since the shares remain constant, the USD volume of the taker’s fill can be computed as:
We can sanity check this formula to verify our Split and Merge labelling by comparing the aggregate sum of maker USD volume for fill orders with the aggregate sum of taker USD volume for full orders.
5. Confounder labelling
Before we apply heuristics, we filter trades that are likely non-directional and optionally exclude them from scoring.
5.1 Notional Farming
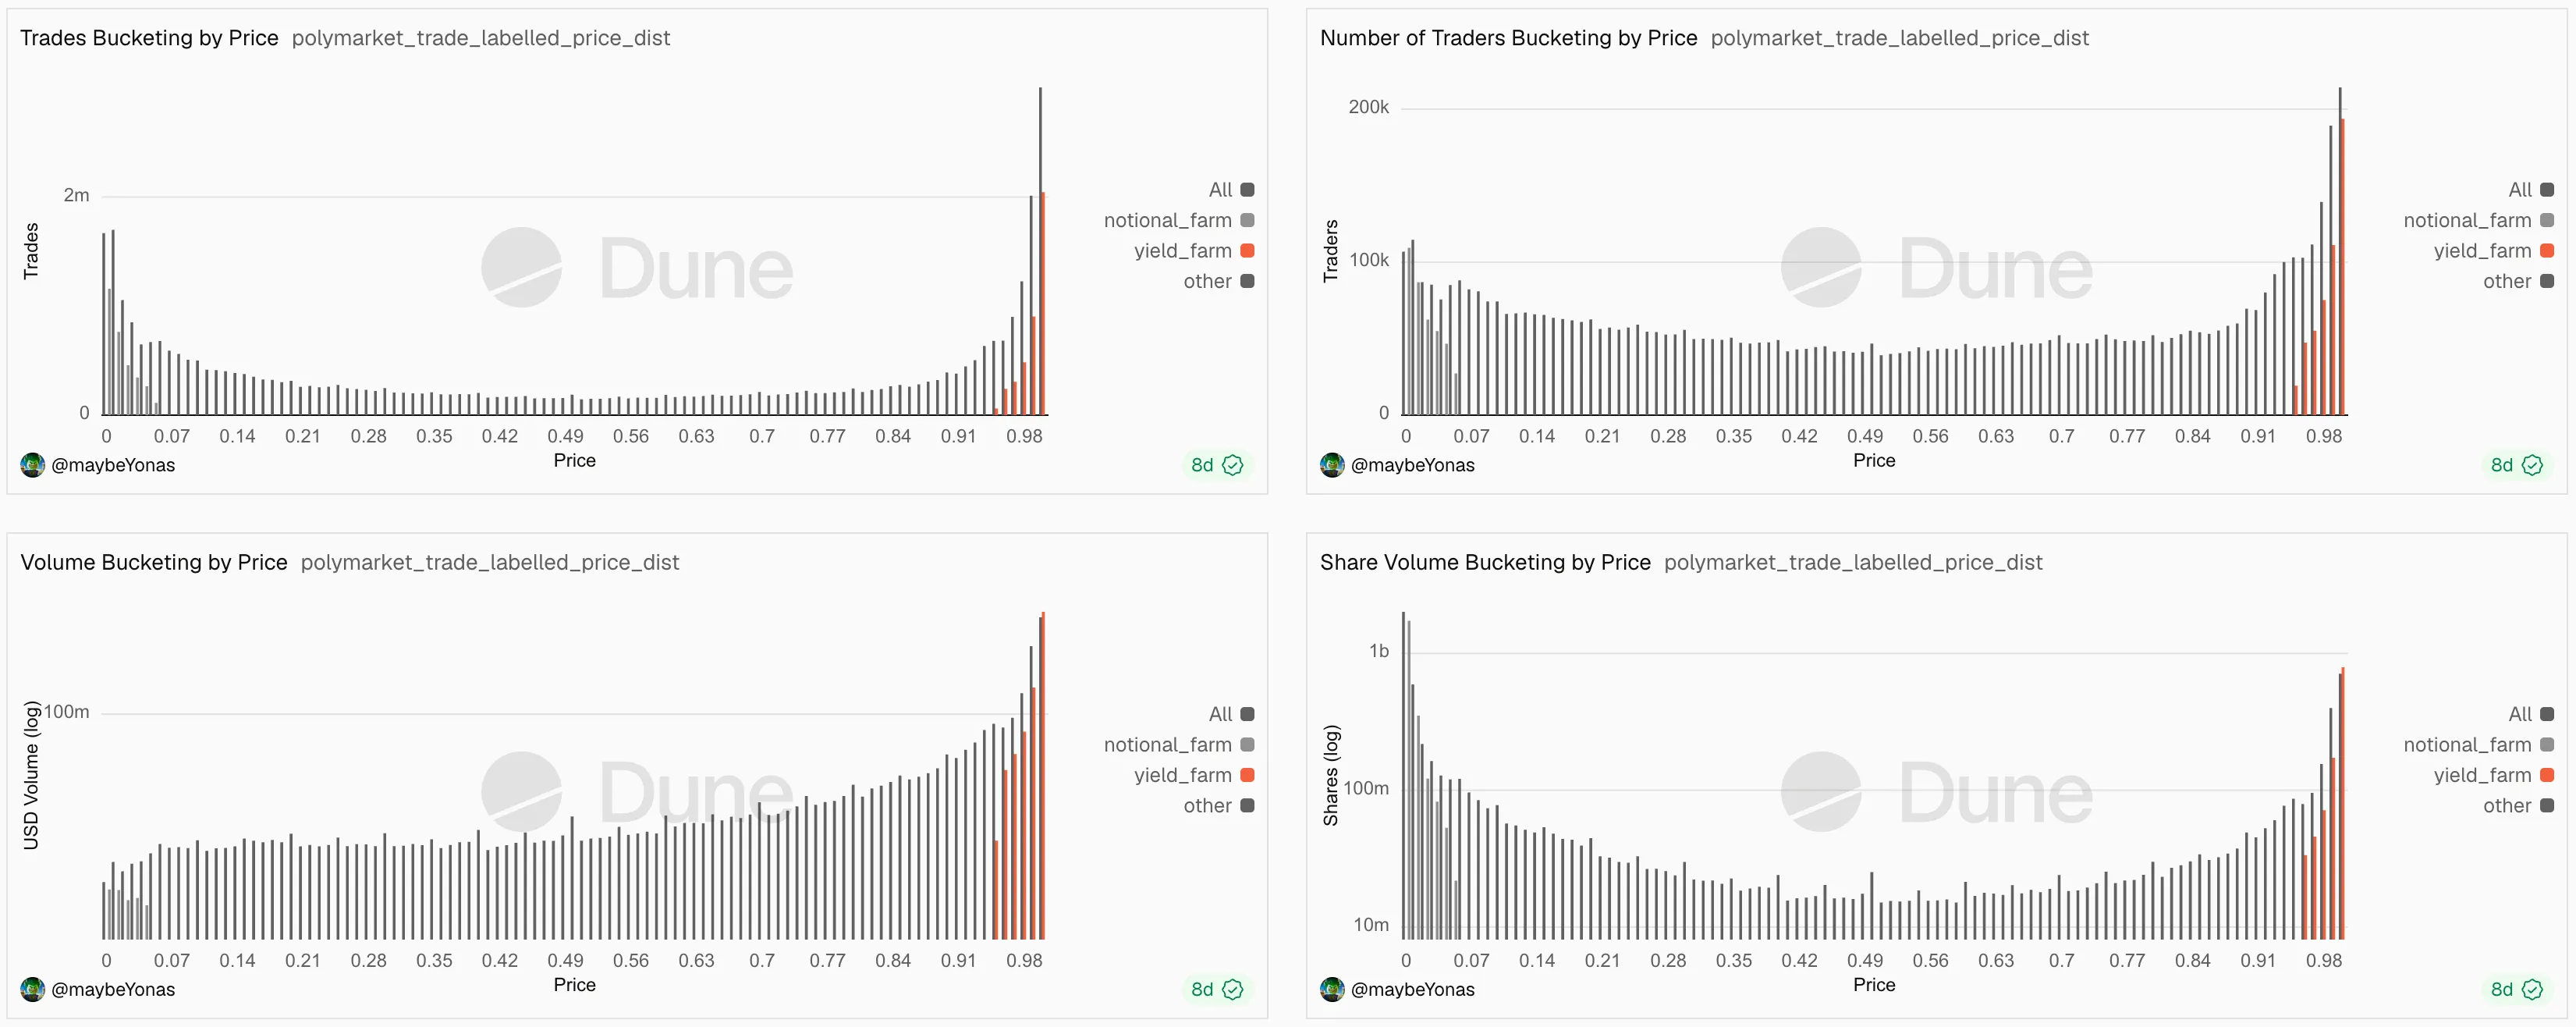
Notional Farming is buying a large number of shares at prices close to zero. This inflates notional volume, with the hope that notional volume would be a major component for a potential Polymarket Airdrop. A trade is labelled notional farming if:
- trader buys tokens priced below 0.05
- the trade occurs at most 48 hours before resolution
- trade is in the opposite direction of the market (i.e. buy a YES when market is going to resolve to NO, or vice versa)
5.2 Yield Farming
Yield Farming is buying near-certain outcomes at prices close to 1 to capture small residual inefficiencies prior to resolution. A trade is labelled yield farming if:
- trader buys tokens priced above 0.95
- the trade occurs at most 48 hours before resolution
- trade is in the correct direction of the market (i.e. buy a YES when market is going to resolve to YES, or vice versa)
6. Detection Heuristics
Six heuristics are used to detect potential insider trades - two qualitative and four quantitative.
6.1. Qualitative Heuristics - Trade Label
H1: Fresh Wallet Trade
Intuition: Insiders often use new wallets to avoid tying their suspicious trades to their identity.
Definition: A trade is a fresh wallet trade, if it occurs within the first 24 hours of the wallet’s first trade. Wallets whose first trade is before November 20, 2025 are exempt, to prevent the dataset starting cutoff from generating too many false positives.
False positives: A new legitimate wallet’s first few trades may be flagged as fresh wallet trades.
H2: Contrarian Trade
Intuition: An insider who knows the outcome of the event will ignore market sentiment, and trade in the correct direction, even if its opposite from the current direction of trend. This results in contrarian trades, where the trade is a bet in the direction against the prevailing trend.
Definition: A trade is a contrarian trade, if it occurs at most 48 hours before the market resolves, and is in the opposite direction of the prevailing trend, i.e one of the following is true:
- trade is a buy at price below *0.40** in the direction of the resolved outcome, i.e buying against market prediction and being correct.
- trade is a sell at price above *0.70** in the direction opposite to the resolved outcome, i.e selling against market prediction and being correct about the reversal.
False positives: Mispriced markets, arbitrage opportunities amongst market clusters, users making long shot bets all get flagged as contrarian trades.
6.2. Quantitative Heuristics - Execution
All four quantitative heuristics use P90 percentile-based scoring instead of the industry standard deviation-based z-score. Z-score is not used as it’s best suited for normal distributions, while our dataset is extremely right-skewed. Z-score would strongly underestimate outliers.
For a trade feature , from a distribution of , the score is computed as:
This score measures how many multiples of P90 the trade exceeds the P90 threshold.
H3: Market Bet-Size Anomaly
Intuition: Insiders with non-public information might have larger bet size than the typical trader. A trade that is larger relative to the rest of the market might indicate insider trading rather than speculation. Definition: We try to ask “Is this trade large for this market?”. The anomaly score compares a trade’s USD bet size to all the other bet sizes in the market. The scores are:
The scores are capped at 100 points - which is the P99 percentile of the bet size distribution. False positives: Larger portfolios might place larger bets, Yield farming trades outside of the current yield farming definition also go with larger than usual bet sizes.
H4: User Bet-Size Anomaly
Intuition: A trader who usually makes a smaller bet size, but suddenly places an unusually large betsize, might do so in response to increased conviction based on potential non-public information. The aim is to use the user’s own bet size history to catch behaviour change.
Definition: We try to ask “Is this trade large for this user?”. The anomaly score compares a trade’s USD bet size to the user’s own bet size history. The score is:
The scores are capped at 50 points - which is the P99.9 percentile of the bet size distribution.
Since this fires independently from H3, a whale’s large trade may not trigger H3 but not H4, while a smaller wallet’s large trade will trigger H4 but not H3. False positives: Wallets who previously were testing waters, and are now confident to commit larger bets, wallets after new public information before resolution tend to commint bigger sizes.
H5: Market Spread Anomaly
Intuition: The price range of individual fills that fill a single order is an indicator or urgency. An insider with time-sensitive information might be willing to accept more spread than a normal user in the same market.
Definition: We try to ask “Is this trade’s execution cost is higher than expected, when compared to other trades in the same market?”. The anomaly score compares a trade’s market spread to the market’s own spread. A key difference is that since the distribution is extremely zero-heavy, we only compare against non-zero spread in the same market. The score is:
Scores are capped at P99.9 value of 100 points to avoid extreme outliers.
Only non-zero spreads above 1e-6 are included in the distribution, so that single-fill orders with zero spread and floating point precision errors do not skew the distribution. False positives: Legitimate orders that are executed in thin orderbooks, algorithmic traders sweeping liquidity in reponse to a new public information before resolution, all get flagged.
H6: User Spread Anomaly
Intuition: A trade who usually executes cleanly with single fills or tight multifill spread, but suddenly accepts a wider spread, might have priortized execution confirmation over execution quality. This could indicate a change in the user’s behaviour in terms of urgency. Definition: We try to ask “Is this trade’s execution cost is for this user?”. The anomaly score compares a trade’s market spread to the user’s own historical spread. Similar to H5, since the distribution is extremely zero-heavy, we only compare against non-zero spread in the same market. The score is:
Scores are capped at P99.9 value of 50 points to avoid extreme outliers. False positives: Wallets with very few trades but spread-generating trades have unstable P90s. Users who happen to trade during a low liquidity, high volatility period when market makers have pulled liquidity in response to volatile new public information have to accept spreads.
7. Composite Scoring
7.1. Trade Scoring
Each trade receives a composite score that combines all six signals. The quantitative scores are capped to prevent extreme outliers from dominating the ranking.
| Signal | Type | Cap / Weight |
|---|---|---|
| Market bet-size anomaly | Quantitative | Capped at 100 pts |
| User bet-size anomaly | Quantitative | Capped at 50 pts |
| Market spread anomaly | Quantitative | Capped at 50 pts |
| User spread anomaly | Quantitative | Capped at 50 pts |
| Fresh wallet trade | Qualitative | Fixed 25 pts |
| Contrarian trade | Qualitative | Fixed 75 pts |
| Maximum composite | 400 pts |
For quantitative signals, the caps are derived from the P99 to P99.9 percentile values of the non-zero distribution of the score. This percentile choice means at most 2000 to 20,000 trades would be capped. These thresholds are chosen heuristically and can be considered as a tunable parameter for future modeling.
When trades with zero scores all on all signals are dropped, the working dataset reduces from 18.3 Million to approximately 1.84 Million suspicious trades.
7.2. Wallet Scoring
Aggregating trade scores to a wallet level requires extra care. A simple summing aggregation would result in high-volume traders dominating the ranking. Traders with fewer but suspicious trades would be drowned. Moreover, it would be impossible to distinguish between high-volume traders with a few suspicious trades and just plain high-volume traders.
To mitigate this, we calculate the wallet score as follows:
- Only trades that were in the correct direction of resolution, i.e winning bets, are included. Since we do not provide user market context for a trade, we
- The P99 percentile score of all the qualified trade is used as wallet’s final score. For low volume wallets, this enables that their top trade is the score of the wallet. For high volume wallets, bottom 99% of the trades drag down the score calculations.
This design choice ensures high-volume wallets with suspicious trades are still flagged, while also flagging low-volume wallets with suspicious trades and ignoring high-volume wallets with more legitimate trades.
8. Validating against known Insiders
The scoring framework and ranking are validated against three publicly reported insider wallet/clusters. The aim is to sanity check the results of the framework.
8.1. Google Insider - AlphaRacoon
From November to December 2025, a wallet made 1 million USD in profits by betting accurately on Google-related markets. The wallet 0xee50a31c3f5a7c77824b12a941a54388a2827ed6 under the name AlphaRacoon correctly bet YES on the “Will Gemini 3.0 be released by November 22?” and the “#1 Searched Person on Google this year?”, as well as correctly bet NO on the losing markets. The owner of this wallet was recently charged by the Department of Justice with one count of violating the Commodity Exchange Act.
Framework Result:
The wallet ranks 652nd with a P99 percentile score of 101.55. Its highest scoring trade is a large NO bet on “What day will Gemini 3.0 be released?”. A key point to note is that, the “#1 Searched Person on Google this year?” are scored lower. The reason for this will be discussed later.
8.2. US Military Insider - Venezuela / Maduro
On Jan 3rd, 2026, US President Trump announced that Venezuela’s President was captured in a sting operation, code named “Operation Absolute Resolve”. This being an executive decision meant that non-public information before the Presidential Address was non-existent. A cluster of wallets was detected to have taken large positions in the market before such information was made public. An active-duty Army Special Forces Sergeant Gannon Ken Van Dyke, was arrested and charged with 3 counts of violating the Commodity Exchange Act.
Framework Results:
| Wallet | P99 Score | Rank |
|---|---|---|
0x6baf05d1... | 126.19 | 102 |
0xa72DB174... | 86.39 | 1,243 |
0x31a56e9E... (Van Dyke) | 65.50 | 2,612 |
Almost all wallets rank within the top 2500. The Van Dyke wallet ranks somewhat lower than expected because the trade amounts were relatively small.
8.3. ZachXBT Axiom Investigation - Axiom or ZachXBT insider
On Feb 23rd, 2026, ZachXBT announced that there is an ongoing investigation with respect to a specific insider trading operation in a DEX and that the details would drop on Feb 26th, 2026. A market “Which crypto company will ZachXBT expose?” was created to speculate on which DEX was being investigated. The market had Meteora priced in at 43% implied odds and Axiom at 13% implied odds. A cluster of wallets entered Axiom YES positions at low prices before the announcement from ZachXBT resolved the market.
Framework Results (Top 5 Wallets):
| Wallet | USD Volume | P99 Score | Rank |
|---|---|---|---|
0xe56526b2... | 100,500.00 | 125.00 | 142 |
0x054ec2f0... | 692,243.85 | 102.15 | 592 |
0x581f3434... | 4,978.05 | 86.93 | 1,230 |
0x98a96619... | 19,117.34 | 86.08 | 1,253 |
0x5e524f43... | 16,247.87 | 76.45 | 1,745 |
The top two wallets rank in the top 600, and the full cluster is concentrated in the top 3000.
9. Error Analysis
9.1. False Positives
One of the highest-scoring trades in the dataset is a “Nuclear weapon detonation by June 30?” NO purchase worth 20,000 USD, scoring 176 P99 points. This is very likely not an insider trade, since this is a low-information, rational trade.
This highlights a key gap in this framework: the model doesn’t account for rationality. A NO trade on a market with existential risk carries a different thinking pattern than a NO in a corporate decision market.
Extra effort in filtering specific markets would reduce these errors.
9.2. False Negatives
In the AlphaRacoon case, one of the most high profile trades was YES buy on “Will d4vd be the #1 searched person on Google this year?”. This was primarily because this was a contrarian trade with an implied probability of around 6%. However, this trade is scored relatively low, with the contrarian trade component performing the bulk of the score lifting.
This was a position that was augmented with larger positions betting NO on the markets of other potential candidates. Individually, these trades may fail below scoring thresholds in each individual market. However, if aggregated within a question, correcting betting on different versions of the same event is a strong signal of insider information.
10. Limitations
10.1. Onchain-only
The framework only accounts for onchain data, with no access to off-chain event feeds, news timing, or social media activity. This means trades made in response to off-chain signals cannot be distinguished from trades made on non-public knowledge. This is extremely evident in Twitter and Sports markets, where off-chain signals can confirm resolution hours and even days before the actual onchain resolution.
10.2. Incomplete PnL Reconstruction
PnL and ROI are strong signals to filter potential insider trades. This is also very frequently used in existing literature.
I have deliberately excluded PnL and ROI from this framework. This is because:
- Existing literature uses aggregation of Trading PnL from
OrderFilledevents (backbone ofmarket_tradesdataset) and combines it withPayoutRedemptionevents. This, however, doesn’t account for wallets that obtain exposure to an outcome by mintingYES/NOpairs and selling the opposite side into the market. A simple negative shares sanity check flags this issue. Moreover, positions created by such minting would show up as losing positions on aggregations, as it creates negative balances. - The correct methodology for PnL reconstruction is to unwrap ERC-1155
BatchTransferevents and ERC-1155SingleTransferevents and compute the share balances from the asset movements. This needs to be combined with Trading PnL to estimate PnL and ROI. However, this combination is significantly more expensive computationally on Dune.
10.3. Scoring Parameters Sensitivity
All scoring parameters - contrarian cutoffs, P90 anomaly thresholds, P99 caps, qualitative weights - are chosen heuristically. The rankings are hence sensitive to these parameters. A more robust approach would be to:
- Learn thresholds from labelled examples using a supervised learning approach
- Used Median Absolute Deviation (MAD) based z-score to score outliers thoughtfully.
The current implementation avoids MAD-based z-score, as DuneSQL lacks a native MAD function, and a manual implementation requires multiple data passes; hence, it is computationally expensive.
10.4. Historical Wallet Context
While the analysis is strongly constrained to Onchain data, onchain wallet metadata, such as first transaction timestamp, source of funds, DeFi usage, and cross-chain activity, could add meaningful filters and signals. An example is the fresh wallet detection, which only uses the first Polymarket trade. A wallet that had its first onchain trade 2 years ago has a different risk profile from a wallet that has no onchain activity.
11. Future Work
11.1. Tracking Positions of Traders:
The current framework scores trades individually, with no regard for the past positioning of the trader. Current position size can be used to quantify the conviction of the trader when used in conjunction with the directionality and size of the trade. A position increase in a previously smaller size or a complete flip in direction could indicate changes in the trader’s conviction in response to changing information.
An example is AlphaRacoon, who took a small YES position in “#1 Searched Person on Google This Year - Kendrick Lamar”, which was then sold closer to the resolution. Coinincidentally, Kendrick Lamar finished second in the list, likely suggesting that AlphaRacoon could have known that Kendrick Lamar could potentially displace d4vd, should there be last minute shifts in the rankings.
11.2. Cross-Market Clustering
Multiple related markets resolve on the same underlying event. Grouping these trades into a single market cluster while scoring the trades and positions would improve the detection of composite trading behavior.
AlphaRacoon’s YES position in d4vd were augumented by NO positions in other major candidates such as Trump, Pope Leo XIV, Bianca Censori and Zohran Mamdani. As a result, the position size of AlphaRacoon was effectively larger than what a single market trade would score.
11.3. Wallet Clustering
Axiom investigation market revealed a cluster of about 10 wallets that made smaller positions around similar timeframes. Utilizing extra info such as trading timestamps, source of funds, and entry prices could be used to detect groups of wallets that are likely controlled by the same entity.
11.4. More robust Outlier scoring
This was briefly experimented with before being abandoned due to computational limitations.
Quantile capping can be replaced with a more robust scoring method, where lower thresholds are identified and above which we perform quantile or logarithmic scaling to retain extreme outlier information while still keeping the scores bounded.
Moreover, most outlier thresholds are a single data point for a market or for a user. The ideal way is to define an outlier threshold for each trade individually based on only the trades that occurred before the current trade. This is because only a potential trade is detected; there are existing software stacks to copy trades and pollute the data. Similarly, once information becomes public, legitimate users also tend to make the same decisions in terms of size, execution costs, and timing as those of an insider wallet.
12. References:
- Polymarket Volume Is Being Double-Counted - Storm Slivkoff - Paradigm
- U.S. Soldier Charged With Using Classified Information To Profit From Prediction Market Bets - Office of Public Affairs
- Google Employee Charged With Insider Trading
- Polymarket bettors put $3 million on which crypto firm ZachXBT will expose next - Coindesk
- Insiders cashed in before Axiom reveal, Wallets bagged $1M on Polymarket